
AUSTRALIA, AUD, COAL, AND IRON ORE
The Australian Dollar has a NEUTRAL OUTLOOK for the coming weeks.

The Australian Dollar has a NEUTRAL OUTLOOK for the coming weeks
The Australian dollar points to a balanced three-week outlook. The underlying picture is pulling in opposite directions. Domestic growth has clearly lost steam — the unexpected AUD 3.02 billion trade deficit in May and the soft 0.3% Q1 GDP print are the clearest recent signals. Working against that weakness is the Reserve Bank of Australia, which has stayed hawkish as it battles core inflation that refuses to ease.
Attention is shifting to the RBA’s next rate decision on 11 August 2026. The base case in the market is for policymakers to leave the 4.35% benchmark rate unchanged. Any surprises in the inflation or labor data that land between now and then could still shift the central bank’s bias, though, and that would feed directly into the AUD’s near-term direction.
Australia’s macro backdrop stays complicated. Sluggish underlying growth and a historic trade deficit are running straight into sticky core inflation and continued hawkish talk from the RBA. The result is that the Australian dollar remains stuck in neutral, boxed into a tight range with little conviction on either side.

Balancing Cooling Growth and Persistent Inflation
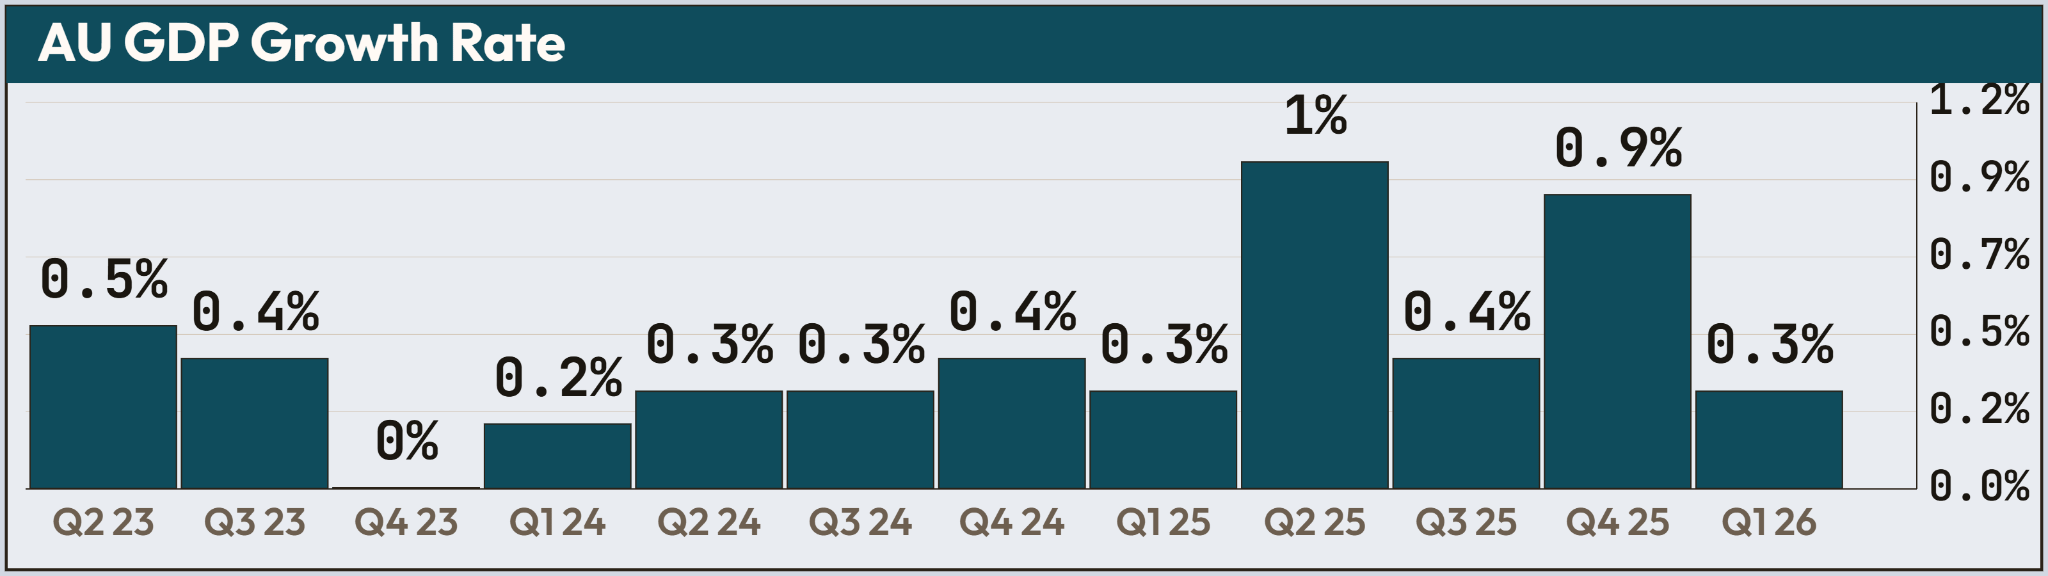
Australia’s macroeconomic landscape is shaped by a sharp tug-of-war between cooling growth momentum and stubborn underlying price pressures. The first quarter delivered sluggish 0.3% GDP growth that fell short of expectations and pointed to softer domestic demand overall. Household spending and retail trade contracted early in the year. May brought further warning signs from the external sector, with an unexpected AUD 3.02 billion trade deficit — the largest since December 2015 — as exports of non-monetary gold and metal ores plunged and imports of capital goods and vehicles rose to a record AUD 46.63 billion.
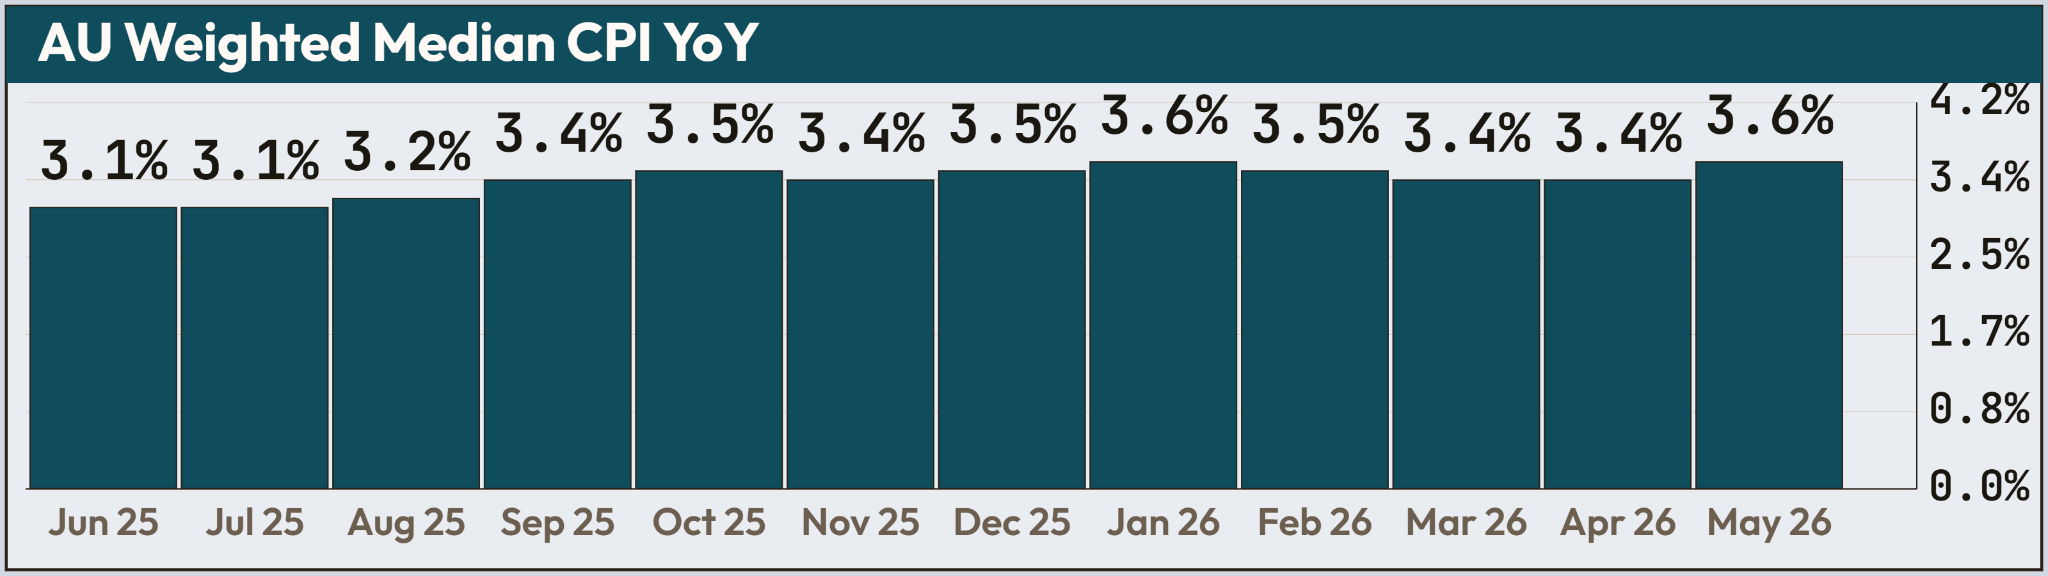
Inflationary forces are proving stickier than the growth data might suggest. Headline annual inflation slowed unexpectedly to 4.0% in May on the back of lower fuel prices, but the trimmed mean CPI accelerated 0.4% month-on-month, taking the core rate to 3.6%. At the same time the labor market stayed robust, adding 40,300 jobs in May and driving the unemployment rate down to 4.4%. That combination means the RBA will hold a strictly hawkish line.
For the next three weeks the AUD is highly likely to remain range-bound with a slightly bearish bias against the greenback, languishing near three-month lows below the 0.690 handle. Global catalysts, particularly the trajectory of US-Iran peace negotiations and their impact on energy costs, will compete with domestic rate expectations. Yields on the 10-year government bond, hovering near 4.8%, reflect a market that is paring back bets on further near-term RBA hikes while dismissing any imminent dovish pivot.

Gavin Pearson has been studying the currency markets as a retail trader for twenty years.
Fundamental Analysis pages to bookmark…
DISCLAIMER: This site is informational only, NOT financial advice. Trading involves risk, and you could lose money.