
US Dollar Currency Report September (Fed update)

Derbyshire, UK – September 20, 2023: The Fed maintained rates and revised their projections. The outlook for the USD remains bullish. The next update is planned to be published after the final Q2 GDP estimate on Thursday, September 28th or before if any significant event occurs.
Decisions to trade are made at your own monetary risk.
US Dollar Currency Report Summary
The macroeconomic outlook for the US suggests that the dollar may continue to have bullish strength due to high interest rates and the potential for a non-soft landing. The war in Ukraine and the China-US trade war have also created uncertainty, leading investors to seek safe haven assets like the US dollar.
The US interest rate is anticipated to be held at its current high level for a lengthy period which is likely to lead to reduced or deferred borrowing. This suggests a pessimistic outlook for the US economy and may apply upward support to the value of the dollar.
US GDP is projected to deteriorate in Q3. The Q2 report missed expectations and suggests a slightly pessimistic outlook for the US economy which may apply some upward support to the value of the dollar.
US CPI is projected to remain stable in Q3. The August report just missed expectations and suggests a slightly pessimistic outlook for the US economy which may apply some upward support to the value of the dollar.
US unemployment is projected to remain stable in Q3. The August report missed expectations and suggests a slightly pessimistic outlook for the US economy which may apply some upward support to the value of the dollar.
The monetary-policy-hold narrative is likely to apply indifferent pressure to the value of the dollar.
The war in Ukraine will at times cause risk aversion and may lead to increased foreign investment in the bond market and apply upward support to the value of the dollar.
The China-US Trade war narrative may apply upward support to the value of the dollar when it is the news-cycle.
Monetary Policy
The Federal Reserve (Fed) Federal Open Market Committee (FOMC)
The Federal Reserve is the central bank of the United States. The Board of Governors, which has seven members, sets discount rates. The Federal Open Market Committee (FOMC), which has 12 members, sets the levels of central bank money and the federal funds rate. The FOMC members include all members of the Board of Governors, the president of the New York Fed, and four presidents from the remaining eleven Reserve Banks on a rotating basis.
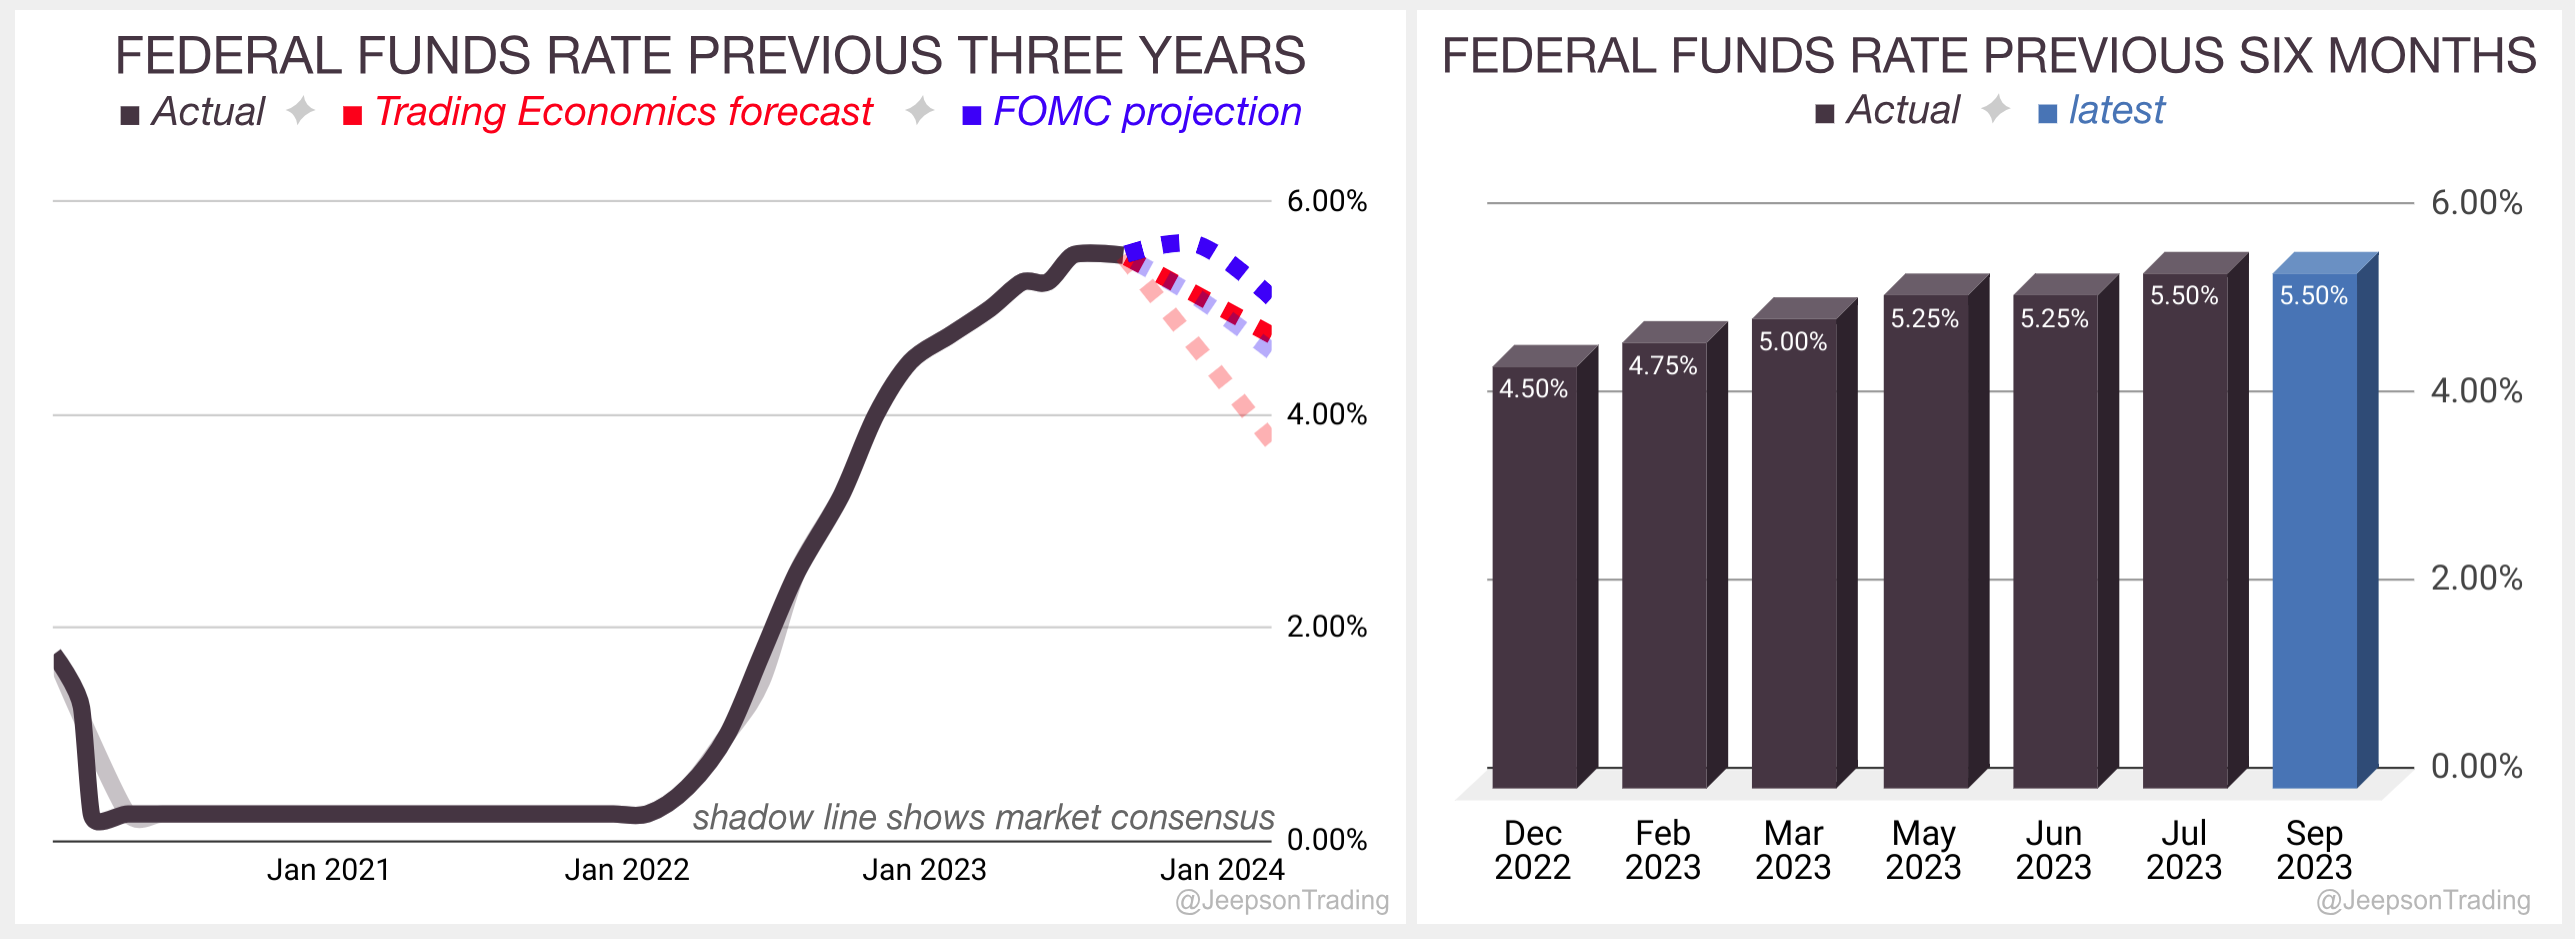
The Fed Funds rate was held as expected at the September meeting, leaving it at 5.25%-5.50%. This matches the hold at the meeting in June.
The rate now matches the Trading Economics Q3 ‘23 forecast of 5.50% which they also identify as the peak
Over the previous three years, since the start of 2020, the interest rate has been trending up with a low of 0.25% and a high of 5.50%. Over the previous six months, the rate has climbed at a slower pace.
The next meeting is due on Wednesday, November 1st.
The Federal Open Market Committee‘s statement summarised:
The US economy is expanding at a solid pace, with strong job gains and low unemployment.
Inflation remains elevated.
The FOMC is committed to returning inflation to its 2 percent objective and will adjust the stance of monetary policy as appropriate.
Sources: Federal Reserve, Trading Economics, FXStreet
FOMC Projections
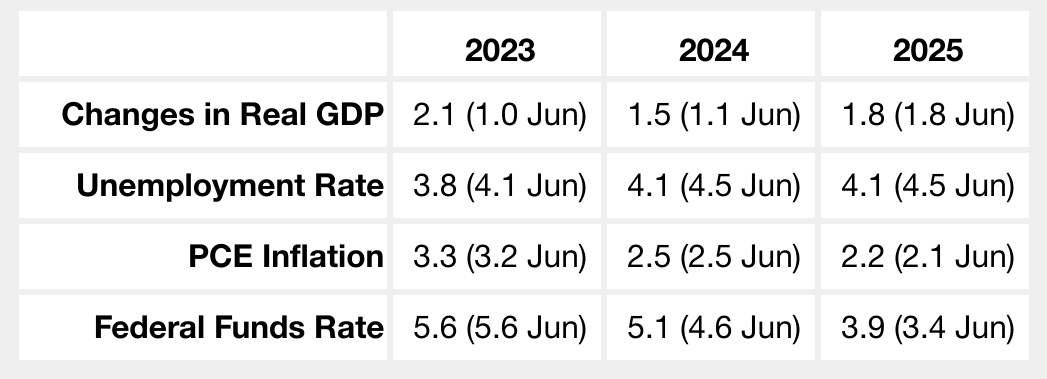
The FOMC revised the projections at their September meeting and will update them again at the December meeting.
Projections of change in real gross domestic product (GDP) are percent changes from the fourth quarter of the previous year to the fourth quarter of the year indicated.
Economic Data
Gross Domestic Product (GDP)
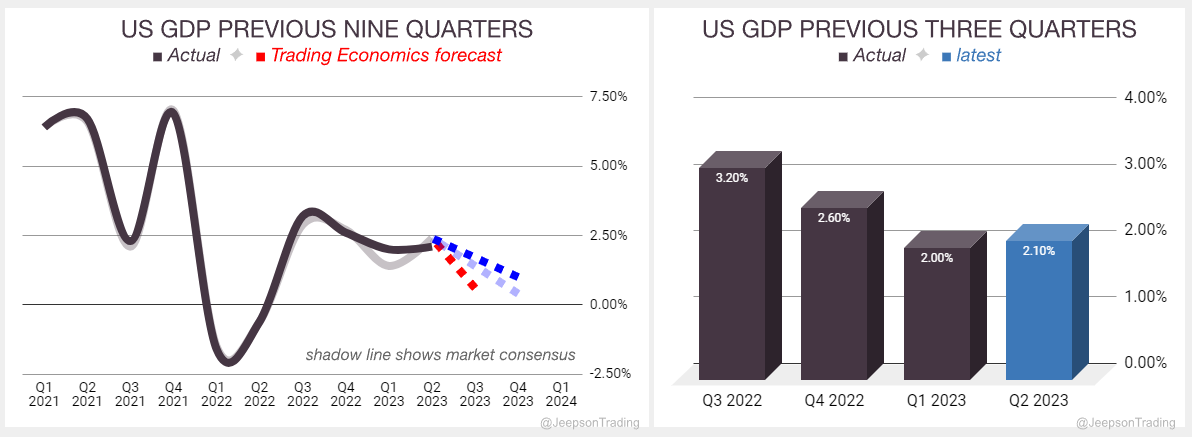
The second estimate of the annualised quarterly change in the value of all goods and services produced by the US during Q2 climbed from 2.0% to 2.1%, below expectations of 2.4%.
Over the previous nine quarters, GDP has been trending down with a low of -1.6% and a high of 7.0%. Over the previous three quarters, GDP has been continuing to fall.
The latest report is on track to achieve the FOMC 2023 change in real GDP forecast of 2.1% (revised up from 1.0%) if the Trading Economics Q3 ‘23 forecast of 0.6% is accurate.
The next report is published on Thursday, September 28th.
Sources: Bureau of Economic Analysis, Trading Economics, FXStreet
Consumer Price Index (CPI)
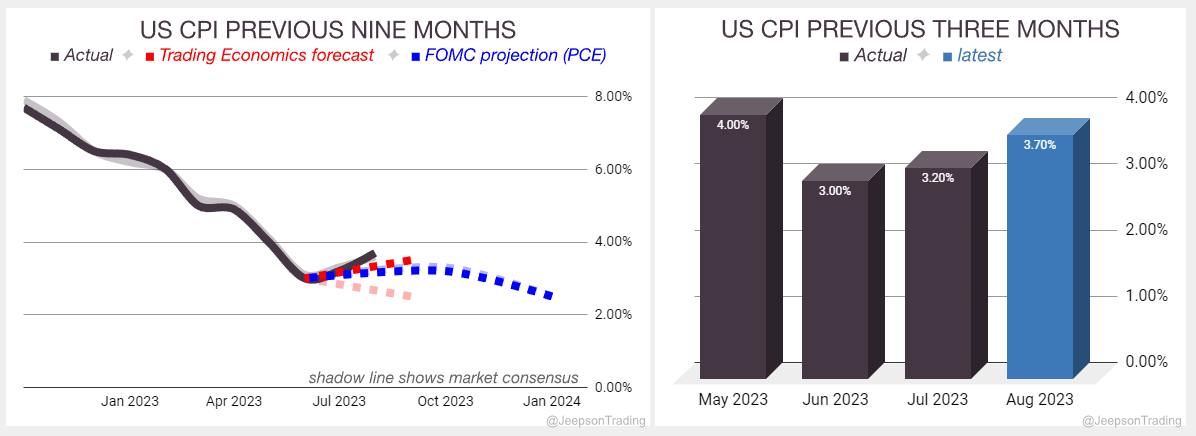
The yearly change in the price of goods and services purchased by consumers in the US during August climbed from 3.2% to 3.7%, just above expectations of 3.6%.
Over the previous nine months, CPI has been trending down with a low of 3.0% and a high of 7.7%. Over the previous three months, CPI has reversed the fall into a climb.
The latest report is on track to achieve the FOMC 2023 PCE forecast of 3.3% (revised up from 3.2%) if the Trading Economics Q3 ‘23 forecast of 3.5% (revised up from 2.5%) is accurate.
The next CPI report is published on Thursday, October 12th.
Sources: Bureau of Labor Statistics, Trading Economics, FXStreet
Labour
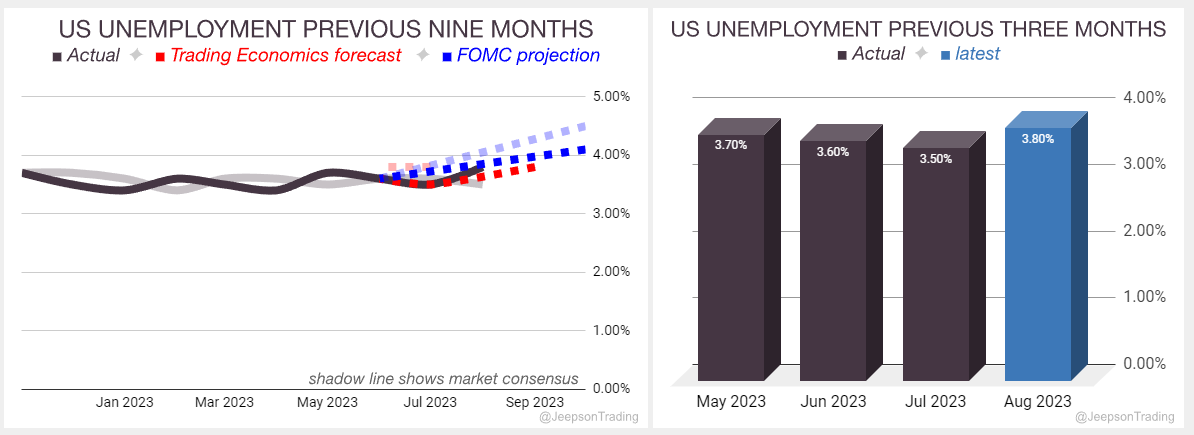
As a percentage of the labour force, unemployment in the US for August climbed from 3.5% to 3.8%, far above expectations of 3.5%.
The change in the number of non-farm workers on payroll in the US for August climbed from 157K (revised down from 187K) to 187K, above expectations of 170K.
Over the previous nine months, unemployment has been moving sideways with a low of 3.4% and a high of 3.8%. Over the previous three months, unemployment has been steady but recently jumped higher.
The latest report is on track to achieve the FOMC 2023 unemployment forecast of 3.8% (revised down from 4.1%) if the Trading Economics Q3 ‘23 forecast of 3.8% (revised up from 3.5%) is accurate.
The next labour report is due on Friday, October 6th.
Sources: Bureau of Labor Statistics, Trading Economics, FXStreet
Market Influences
Monetary Policy Hold
As inflation in the US stabilises, the Fed now intends to hold rates steady. This makes borrowing less risky although it remains expensive. This could improve the outlook for growth, increase the appetite for stocks, and reduce the demand for the dollar as a safe haven.
Russian Invasion of Ukraine
The war in Ukraine has raised concerns about the potential for a wider conflict between Russia and the West. The United States is a member of NATO, and it is committed to supporting its allies in the event of a conflict with Russia.
The war in Ukraine has also had a significant impact on the global economy, causing energy prices to rise and disrupting supply chains. This is having a negative impact on the US economy, which is already facing a number of other challenges.
2022
February 24: Russia launches a full-scale invasion of Ukraine. The US imposes sanctions on Russia, including freezing the assets of Russian banks and individuals.
February 26: The US announces $350 million in military aid to Ukraine.
March 8: The US announces an additional $200 million in military aid to Ukraine.
March 9: The US bans imports of Russian oil and gas.
March 16: The US announces an additional $800 million in military aid to Ukraine.
April 13: The US announces an additional $800 million in military aid to Ukraine.
May 6: The US announces an additional $40 billion in military and humanitarian aid to Ukraine.
June 1: The US announces an additional $700 million in military aid to Ukraine.
July 1: The US announces an additional $400 million in military aid to Ukraine.
August 4: The US announces an additional $550 million in military aid to Ukraine.
September 1: The US announces an additional $675 million in military aid to Ukraine.
September 21: Russian President Vladimir Putin announces a partial mobilisation of Russian forces, calling up 300,000 reservists to fight in Ukraine. The US announces an additional $625 million in military aid to Ukraine.
October 19: US President Joe Biden announces an additional $725 million in military aid to Ukraine.
November 9: The US announces an additional $400 million in military aid to Ukraine.
December 21: Ukrainian President Volodymyr Zelenskyy visits the White House and meets with President Biden. The US announces an additional $1.85 billion in military aid to Ukraine.
2023
January 20: The US announces an additional $2.7 billion in military aid to Ukraine, including Abrams tanks and Bradley Fighting Vehicles.
February 24: On the one-year anniversary of the war, the US announces an additional $2 billion in military aid to Ukraine.
March 8: The US announces an additional $800 million in military aid to Ukraine.
April 13: The US announces an additional $800 million in military aid to Ukraine.
May 6: The US announces an additional $40 billion in military and humanitarian aid to Ukraine.
June 1: The US announces an additional $700 million in military aid to Ukraine.
July 1: The US announces an additional $400 million in military aid to Ukraine.
August 4: The US announces an additional $550 million in military aid to Ukraine.
September 1: The US announces an additional $675 million in military aid to Ukraine.
September 20: The US announces an additional $600 million in military aid to Ukraine.
China-US Trade War
The US-China trade war began in July 2018, when the US imposed tariffs on $34 billion worth of Chinese goods. China retaliated with tariffs on an equal amount of US goods. The two sides then engaged in a series of tit-for-tat tariff hikes, which eventually covered hundreds of billions of dollars worth of goods.
The trade war had a significant impact on the global economy, slowing growth and disrupting supply chains. It also had a major impact on the US and Chinese economies.
2018
July 6: The US imposes tariffs on $34 billion worth of Chinese goods.
July 10: China retaliates with tariffs on an equal amount of US goods.
August 23: The US imposes tariffs on an additional $16 billion worth of Chinese goods.
September 24: The US imposes tariffs on an additional $200 billion worth of Chinese goods.
October 1: China retaliates with tariffs on $60 billion worth of US goods.
December 1: The US and China agree to a 90-day truce in the trade war.
2019
March 2: The US and China extend their trade truce by 90 days.
May 10: The US increases tariffs on $200 billion worth of Chinese goods from 10% to 25%.
May 13: China retaliates with tariffs on $60 billion worth of US goods.
May 15: The US adds Huawei to its "entity list," effectively banning US companies from doing business with the Chinese tech giant.
June 1: China increases tariffs on $60 billion worth of US goods.
June 29: The US and China agree to a two-week cease-fire in the trade war.
October 11: The US and China agree to roll back some tariffs and resume trade talks.
2020
January 15: The US and China sign a phase one trade agreement, which de-escalates the trade war but leaves many tariffs in place.
2021
January 20: Joe Biden is inaugurated as the 46th President of the United States.
February 3: The Biden administration extends the Trump-era tariffs on Chinese goods.
May 19: The US and China hold their first high-level trade talks since the signing of the phase one trade agreement.
October 12: The US and China hold their second high-level trade talks since the signing of the phase one trade agreement.
2022
January 18: The Biden administration announces that it will be reviewing its trade policy with China.
May 19: The US and China hold their third high-level trade talks since the signing of the phase one trade agreement.
September 15: The US and China hold their fourth high-level trade talks since the signing of the phase one trade agreement.
Gavin Pearson
Retail trader since 2008
Specialises in forex G7 currencies
Funded account from the5ers.com
Member of the eToro Popular Investors Program
Regular contributor to FXStreet.com analysis and education pages
Jeepson Trading Fund
Returned 27% in 2022 and 5.8% in 2023 H1
Forex focused
Copy Trading available at eToro
eToro
eToro is a social trading platform
Users can copy trades by clicking the "Copy" button on the profile page
Disclaimer
Past performance is not indicative of future results
Trading involves risk, and you could lose money
-end-